AI/ML & Data Engineer • Copenhagen, Denmark

Two ML platforms in production.
One person built and runs both.

Nordic day-ahead electricity price forecasting, and a trading analytics SaaS with paying subscribers. I own both end to end — ingestion, features, models, cloud infrastructure, monitoring, and the product wrapped around them.

Ship models, not notebooks

From architecture design to a containerised service on Cloud Run that runs unattended for weeks.

Build the pipeline underneath

Live feeds, quality gates, deduplication, retention, and storage designed so a backtest cannot cheat.

Prove whether it works

Walk-forward validation, drift monitoring, and every forecast scored against what actually happened.

Full-Stack AI, Solo-Built at Scale

I'm an AI/ML & Data Engineer based in Copenhagen with 3+ years of hands-on experience building production-grade machine learning systems and data platforms. I don't just train models — I design, build, deploy, and monitor the entire infrastructure that keeps them running reliably in production.

My two flagship platforms — MarketLens (SaaS trading analytics) and EnergyLens (Nordic energy forecasting) — are both live in production on GCP Cloud Run, orchestrating neural ensembles across fully automated pipelines. I recently completed a six-stage GCP data engineering build covering BigQuery, PostgreSQL, Pub/Sub + Beam, Airflow, dbt, and PySpark — all on real production data.

Stanford-trained in ML, certified by AWS and Google, with domain expertise in financial data, energy markets, time series forecasting, and real-time systems. Fluent in Danish, English, and Urdu.

⚙

Automation-First

Every pipeline is designed to run without me. Zero manual steps from data to delivery.

★

Full Ownership

I architect models, build infra, deploy to prod, and monitor in real time. End to end.

⚖

Production-Grade

Docker on Cloud Run, CI/CD, drift detection, self-healing recovery. Not notebooks.

⚘

Data Engineering

BigQuery, dbt, PySpark, Airflow, Beam, Pub/Sub — the full modern data stack.

How both platforms are built — architecture, data pipelines, MLOps, and one bug traced from symptom to decision (2:06)

MarketLens

LIVE • PRODUCTION

Fully Automated AI Trading Intelligence

Product walkthrough — landing page, signal dashboard, quality gate and paper-trading engine (1:11)

A production SaaS platform built on Google Cloud Run. It orchestrates a 7-model neural ensemble — Transformer, CNN-LSTM-Attention, TCN, N-BEATS, LSTM-GRU, Enhanced Informer and XGBoost — across a zero-touch automation pipeline. Real-time data ingestion feeds automated feature extraction of 50+ indicators, flows through ensemble inference and a 5-check quality gate, and delivers results via Telegram and API. Signals cover 19 instruments spanning crypto, forex, commodities and indices, across three timeframes with sub-second inference.

End-to-End Automation Flow
Data Ingestion
WebSocket • FMP • FRED
→
Feature Engineering
50+ indicators per asset
→
7-Model Ensemble
Deep learning + ML stack
→
Quality Gate
5-check validation
→
Automated Delivery
Telegram • API • Dashboard

Self-Healing MLOps

Scheduled GPU retraining on Kaggle, GCS model versioning and webhook-driven hot-reload. Zero-downtime deployments with no redeploy.

SHAP Explainability

Per-prediction feature importance analysis for model transparency and compliance. Every output is interpretable and auditable.

Risk Controls

Fixed-fractional position sizing, volatility-scaled stops, graduated profit targets and max drawdown limits per asset class.

Automated Billing

Stripe integration with 3 subscription tiers, Firebase Auth, per-user Firestore data isolation. Event-driven, fully automated.

dbt Data Pipelines

dbt Core transformation layer with 22 automated tests across 1,718 predictions, 461 execution records, 252 drift logs, 242 equity snapshots.

RAG Chatbot

Gemini embeddings (768-dim), Firestore cosine KNN vector search, LLM generation over 29-document knowledge base for intelligent Q&A.


EnergyLens

LIVE • PRODUCTION

Nordic Energy Market AI Forecasting

Platform walkthrough — ingestion, feature pipeline, forecast, explainability and accuracy tracking (1:06)

A live forecasting platform for Nordic power markets (DK1/DK2). Built with bitemporal data pipelines for point-in-time replay, a 6-model neural ensemble for 24-hour-ahead price prediction, and a 5-gate signal quality framework with SHAP explainability and forecast accuracy tracking. Ingests Nord Pool spot prices, Open-Meteo weather data and ENTSO-E generation data on an automated six-hourly schedule, with 568,681 generation records backfilled across DK1 and DK2 to train on a full year of wind, solar and thermal output.
EnergyLens Architecture
Nord Pool · ENTSO-E · Weather
Bitemporal ingestion
→
Feature Pipeline
110+ engineered features
→
6-Model Ensemble
CNN-LSTM • TCN • N-BEATS
→
5-Gate Quality
Confidence • Consensus
→
React Dashboard
DK1/DK2 • SHAP • Accuracy
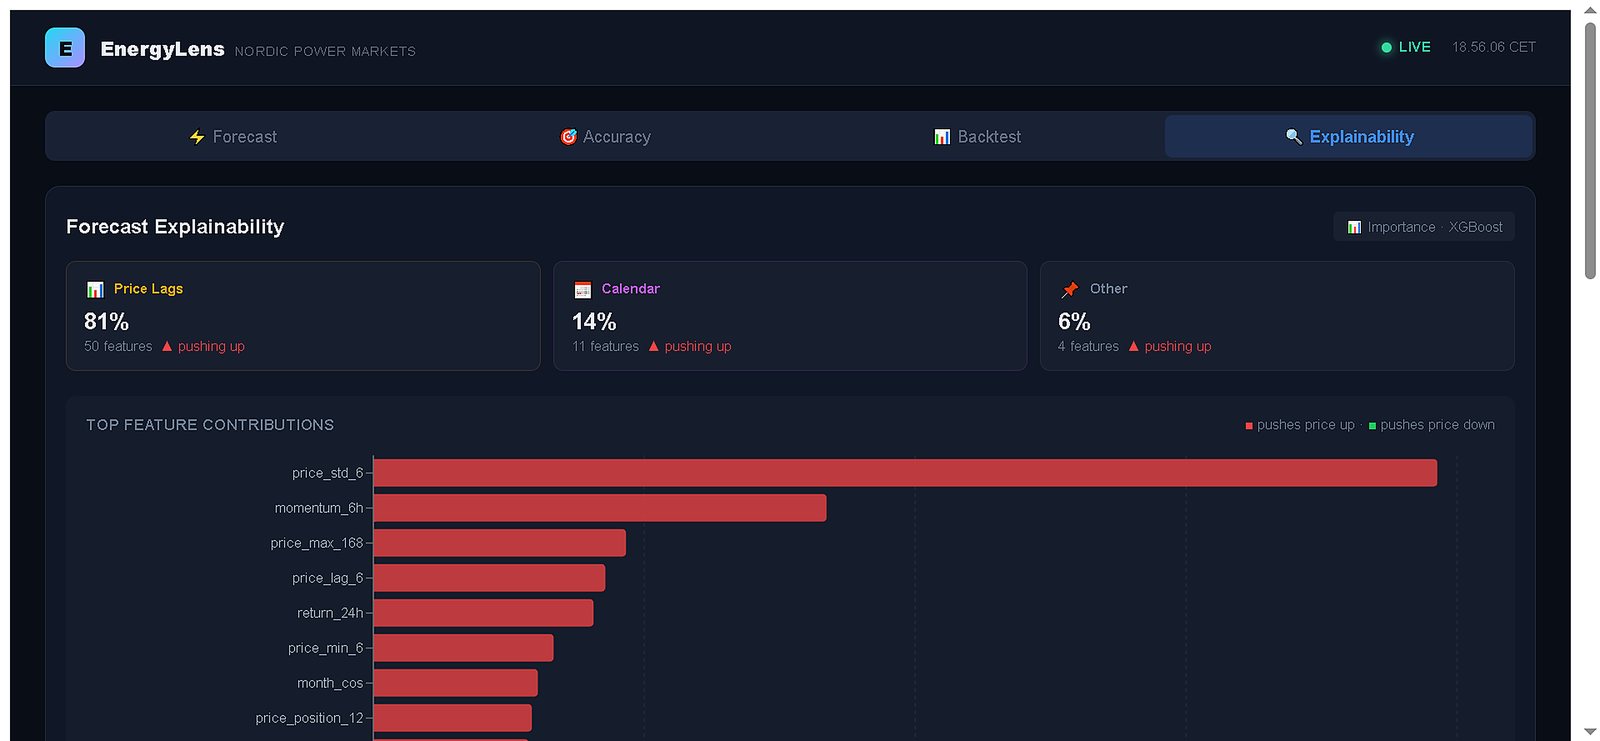
EnergyLens explainability tab showing grouped feature importance and top feature contributions
Explainability tab — price-lag features drive 81% of prediction power, calendar encodings 14%

Bitemporal Pipeline

valid_time and knowledge_time columns enable point-in-time historical replay. Forward-fill non-price features, temporal advancement, absolute-mode clamping.

SHAP Explainability

Grouped feature importance analysis (temporal, weather, price history) providing transparent, auditable rationale for each forecast cycle.

Accuracy Tracking

Automated engine comparing predictions against actuals with per-model MAE/RMSE breakdown, historical trends, and directional accuracy metrics.

Generation Features

568,681 ENTSO-E records across DK1/DK2 drive wind, solar and total-output features — lags, rolling means, volatility and price-per-MW ratios.

Zero-Touch Refresh

Cloud Scheduler triggers ingestion, feature build and forecast every six hours. Retrained models hot-reload from GCS without a redeploy.

Ensemble Weighting

Model outputs blended by inverse-MSE weighting derived from walk-forward cross-validation — no single point of model failure.

Honest Monitoring

12,000+ forecasts logged and scored against actuals across 24/48/72h horizons. Systematic bias in the tracker is what triggers retraining.

Lean Ops

React 18 + Vite dashboard on a FastAPI backend with 15+ REST endpoints, containerised on Cloud Run and running inside the GCP free tier.

Signal Quality Gate

Five gates — confidence band, model consensus, data freshness, forecast stability and volatility — block low-trust forecasts before publication.
Production Data Engineering on GCP

Six-stage pipeline build on real production data from EnergyLens and MarketLens, executed end to end in GCP Cloud Shell.

Step 1

BigQuery

13 analytical queries across 3,895 records — window functions, CTEs, partitioned tables, cross-dataset joins.

Step 2

PostgreSQL

Docker-hosted with 8 tables, 3 schemas, triggers, views, and referential integrity on production data.

Step 3

Pub/Sub + Beam

3-branch streaming pipeline with real-time anomaly detection, windowed aggregations, dead-letter queues.

Step 4

Apache Airflow

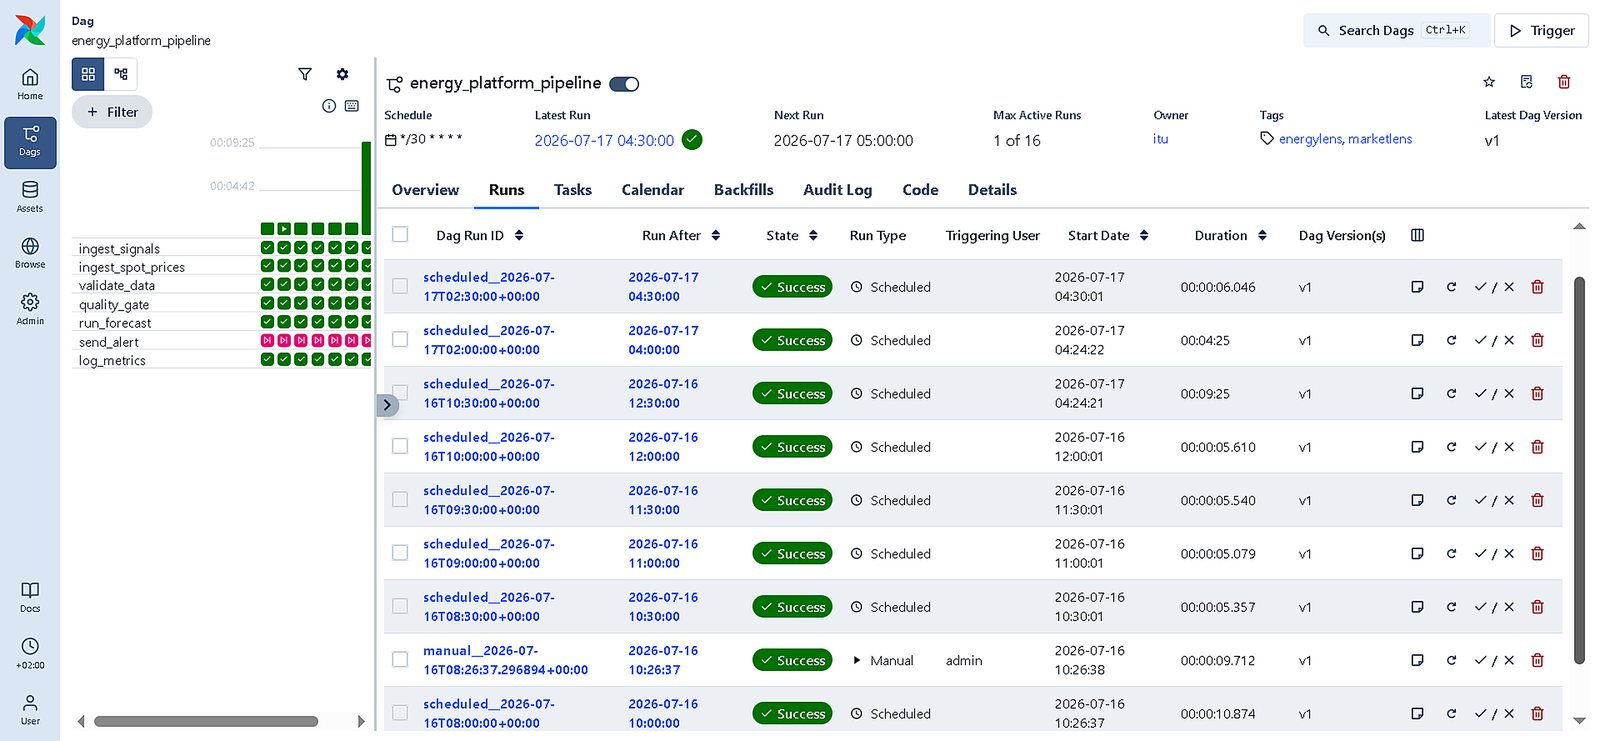
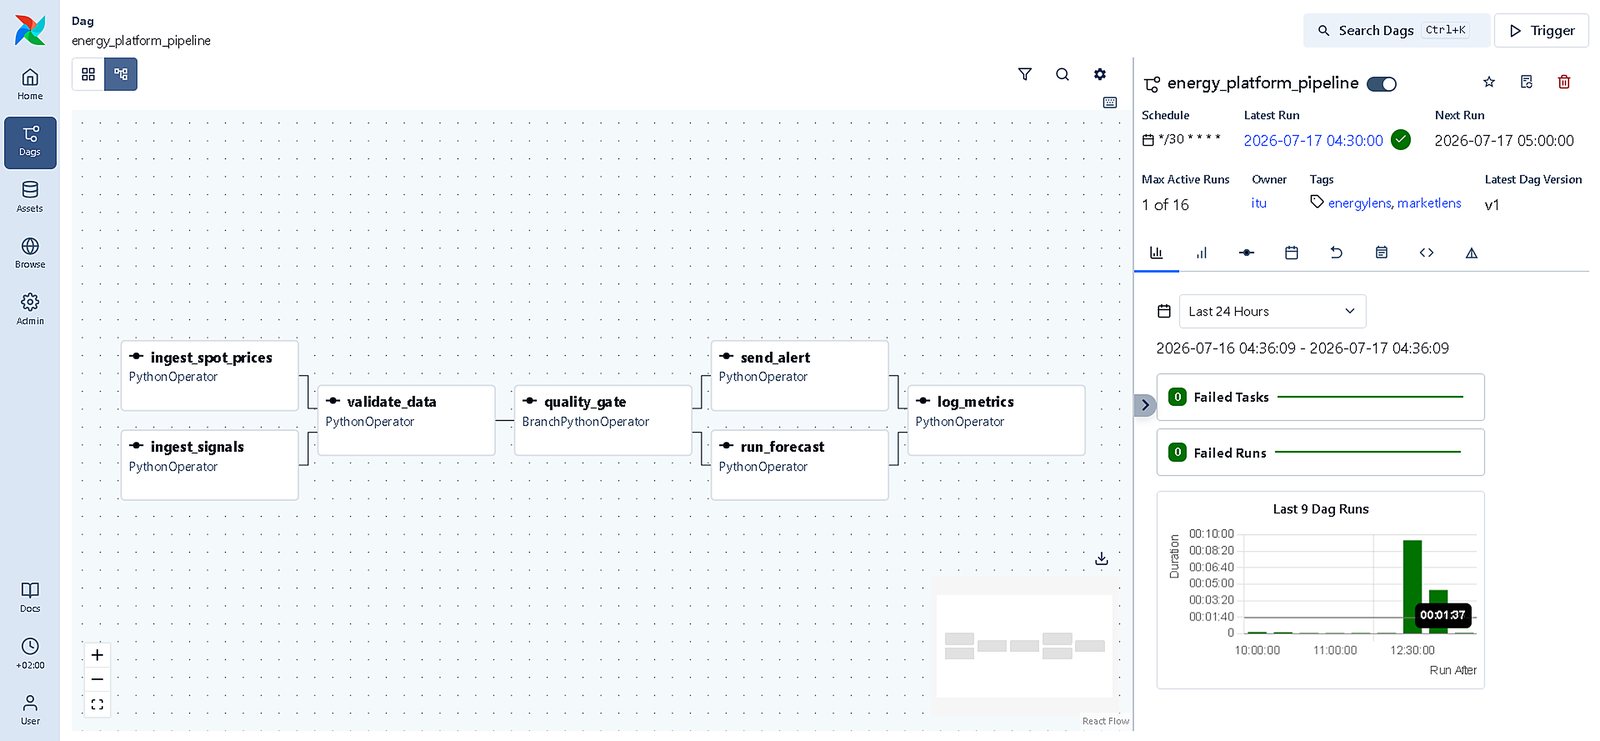
7-task DAG, BranchPythonOperator quality gate, 30-min cron, 16 successful runs, 0 failures.

Step 5

dbt on BigQuery

7 models (staging/intermediate/marts), 29/29 tests, SCD2 snapshot, source freshness monitoring.

Step 6

PySpark

75 engineered features across 4 datasets, UDF regime classification, window functions, Parquet outputs, interactive dashboard.

Airflow Runs tab showing 16 scheduled and manual pipeline runs, all successful
Airflow — 16 runs, 0 failures, full audit trail with duration and DAG version
Airflow DAG graph: two parallel ingestion tasks into validation, then a branching quality gate
Parallel ingestion → validation → BranchPythonOperator quality gate → forecast
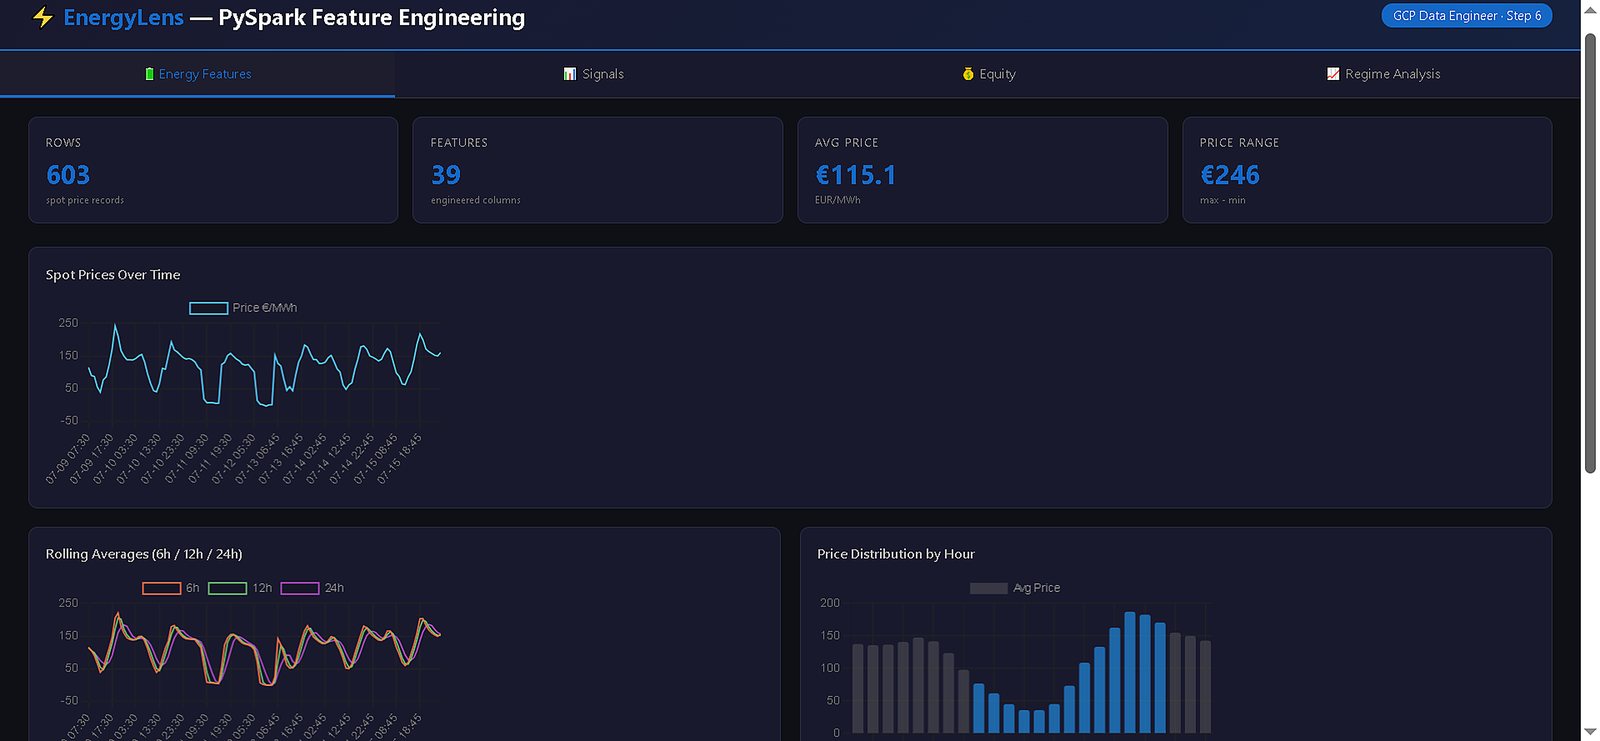
PySpark dashboard showing 603 spot price records transformed into 39 engineered feature columns
PySpark — rolling averages, hourly distributions and cyclical encodings on Nordic spot prices
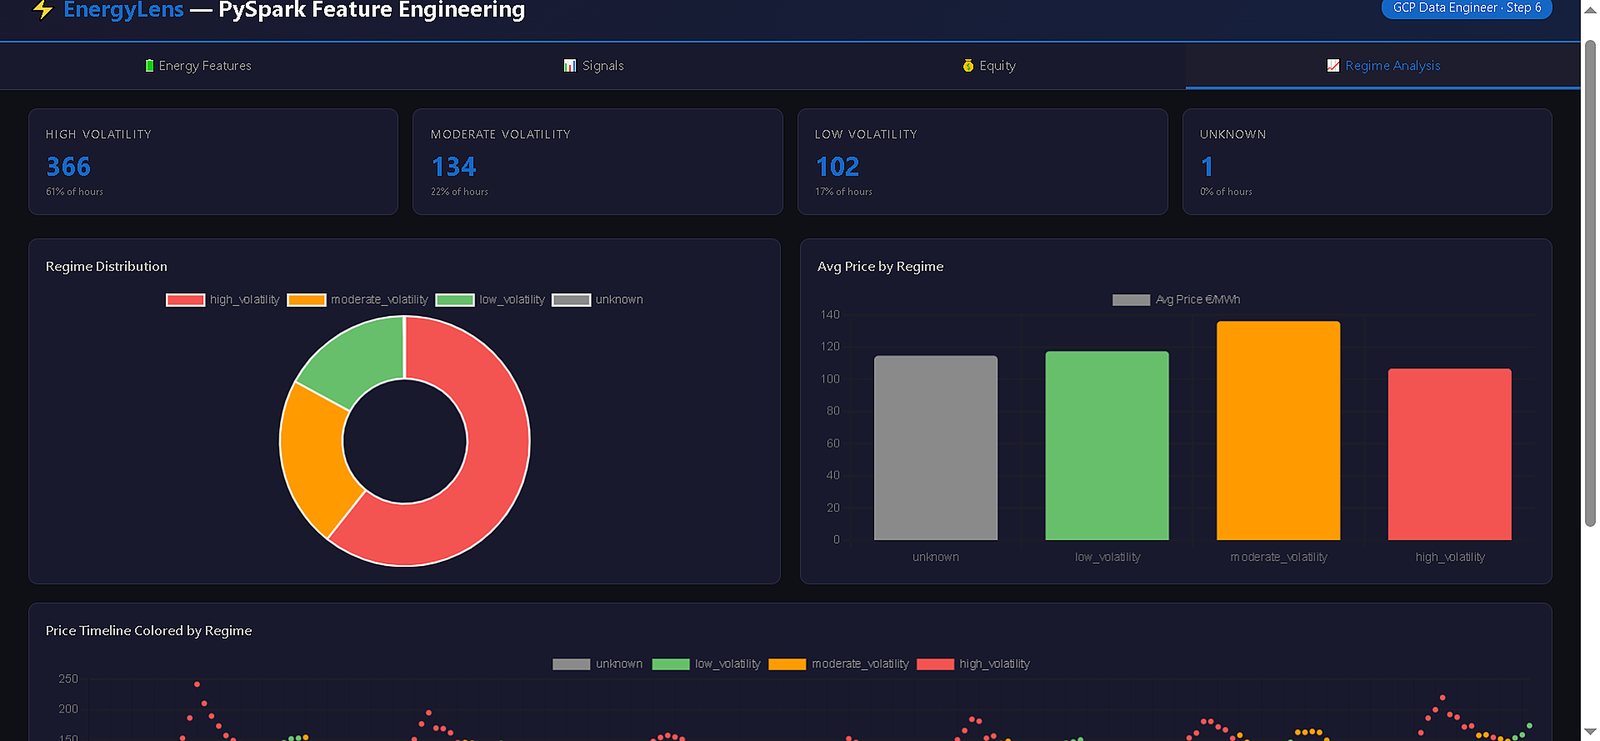
PySpark regime analysis classifying hours into high, moderate and low volatility
Custom UDF classifying every hour by volatility regime — 366 high, 134 moderate, 102 low
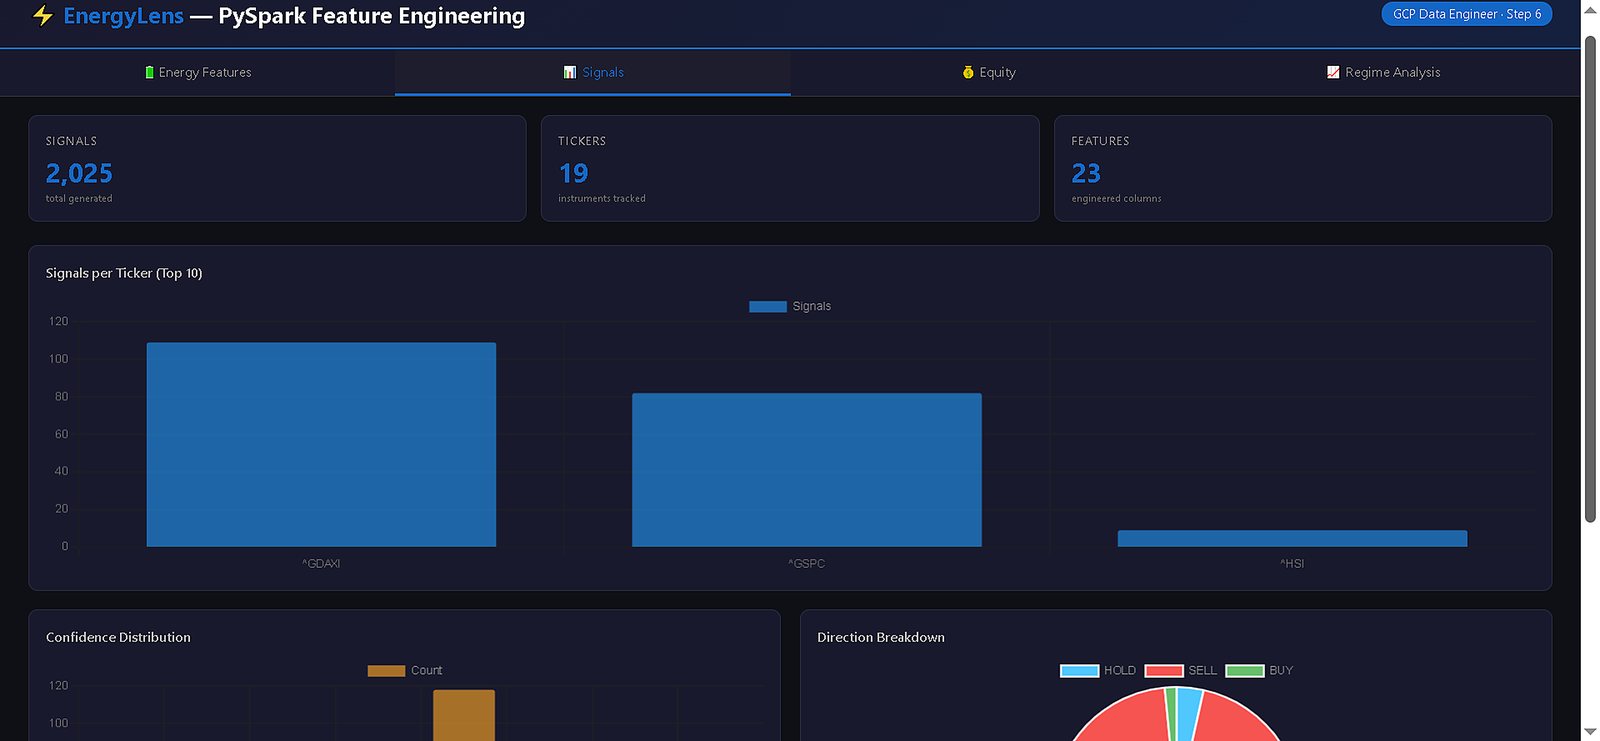
PySpark signals dashboard: 2,025 trading signals across 19 instruments with 23 feature columns
2,025 signals across 19 instruments, described by 23 engineered feature columns
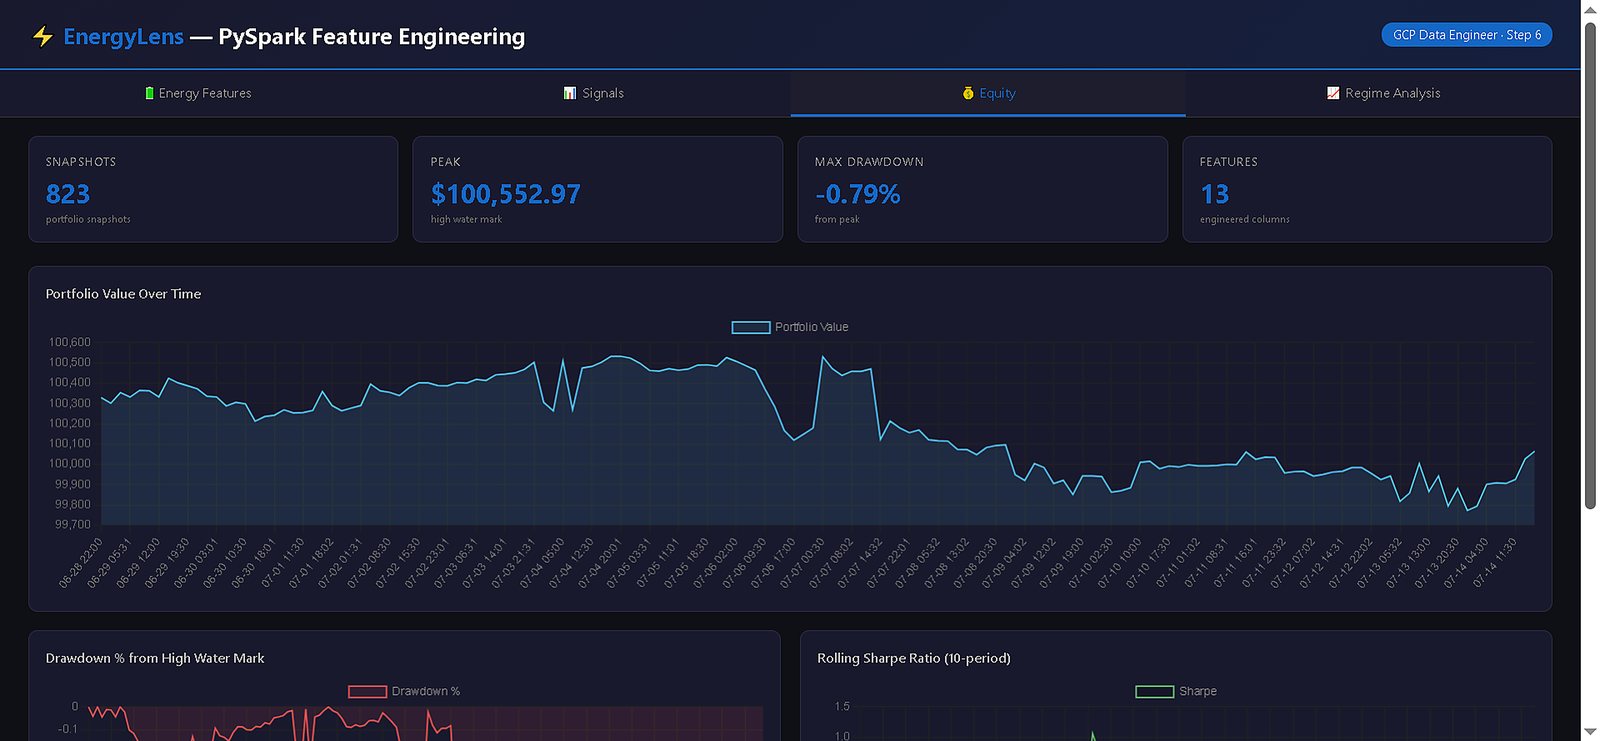
PySpark portfolio equity analysis with drawdown and rolling Sharpe ratio charts
823 equity snapshots with drawdown-from-high-water-mark and rolling Sharpe, in window functions

Tech Stack

AI / Machine Learning
TensorFlow PyTorch Scikit-learn XGBoost LightGBM SHAP MLflow Optuna
Deep Learning Architectures
Transformers CNN-LSTM-Attention TCN N-BEATS Enhanced Informer Encoder-Decoder
Data Engineering
dbt Core BigQuery PySpark Apache Airflow Apache Beam Pub/Sub Firestore DuckDB PostgreSQL Parquet
Cloud & Infrastructure
GCP Cloud Run Cloud Storage Cloud Scheduler AWS Docker CI/CD Git Firebase
Automation & APIs
FastAPI Asyncio WebSocket Webhooks React Stripe Telegram Bot Streamlit

Education & Certifications

AWS Cloud Practitioner

Amazon Web Services
2024

Advanced Data Analytics

Google
2023

ML Specialization

Stanford / DeepLearning.AI
2023

AI in Project Management

Copenhagen Business School
2022

Financial Operations

Niels Brock Copenhagen
2020

GCP Data Engineering

Self-directed build
2026

How I Work

Automation-First

Every pipeline I build is designed to run without me. From data ingestion to model retraining to delivery, I eliminate manual steps systematically.

Full-Stack Ownership

I don't hand off. I architect the models, build the infrastructure, deploy to production, and monitor in real time. Two live platforms prove I can do it all solo, at production scale.

Production Over Prototypes

Jupyter notebooks are for exploration. I ship Docker containers on Cloud Run with CI/CD, drift detection, and self-healing recovery. If it can't survive a weekend without me, it's not production.

Open to AI/ML, Data Engineering & ML Platform Roles

Copenhagen-based • Open to remote & relocation • Danish, English, Urdu